

Written with Deb Verhoeven.
A few days before Christmas, we published an article in the Conversation on the latest funding crisis facing the National Library of Australia’s Trove service. It included the following:
For many people – and not just academic researchers – Trove is now part of their daily lives. The service boasts more than 22 million visits per year: around 63,000 a day on average. Trove is one of only two Australian government websites in Australia’s top 15 global internet domains – the other is the ABC.
The ’22 million visits’ claim appears often. It’s in the Sydney Morning Herald’s piece on looming budget cuts by Linda Morris from 21 December, and the ‘Chair’s report’ that opens the NLA’s 2021-2022 Annual Report. The Trove Strategy for 2021-2023 refers to 63,564.5 Average Daily Sessions—that’s a little over 23 million per year.
Over the past six years, the average number of visits or sessions is just over 22 million per year. But, as David Coombe has been pointing out on social media for a couple of months now, the year by year numbers show what looks like a significant decline in site visits.
The following chart shows the number of visits (in millions) to NLA Online and Trove, as presented in NLA annual reports, starting in 2015-2016 when the Library started reporting on Trove separately (and one year after they replaced AWStats with Google analytics for their usage numbers).
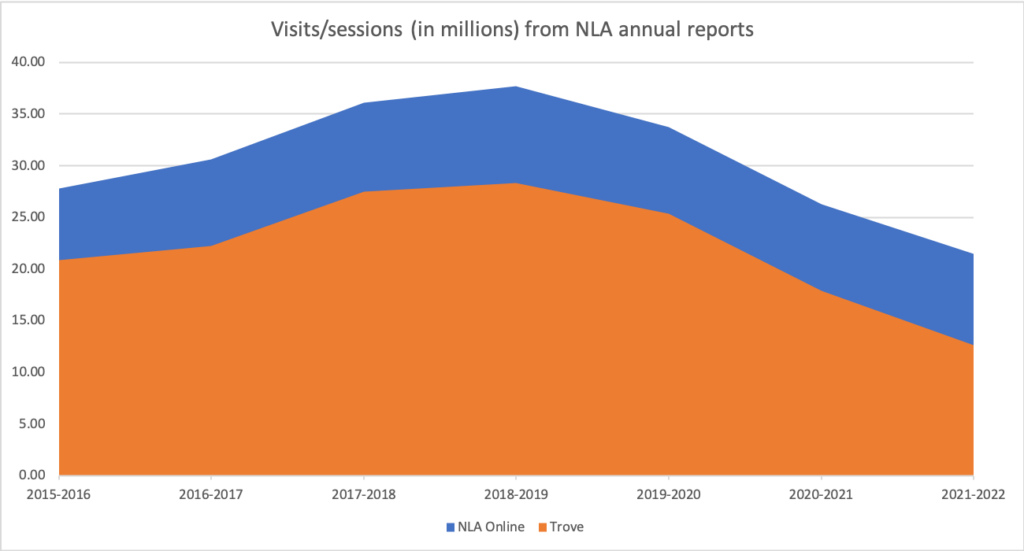
From a high of 28.3 million in 2018-2019, the number of reported Trove visits has dropped to 12.6 million in 2021-2022. It would seem the NLA—not unlike other organisations that are required to report to government—has used multi-year averaging to disguise a different, less flattering, story.
There are some unexplained variables here. In 2019-2020 the NLA started reporting ‘sessions’ rather than ‘visits’, without clearly defining the difference. While there is sometimes a distinction drawn between the two, in the absence of evidence to the contrary it would seem they are the same thing with a different label.
The annual reports also don’t contain a lot of analysis of these statistics. In 2020-2021, when the number of Trove sessions went down from to 17.9 million (from 25.32 million the previous year) we get the following:
A decrease in Australian usage of the Library’s websites and other online engagements with the Library largely reflects a reduction in reported Trove usage, partly attributable to less automated traffic being recorded (such as search engine crawler bot activity) as well as a technical issue that meant that some content was not ‘findable’ through Google searches for part of the year. (2020-2021 Annual Report, p. 27)
And, in relation to the most recent decline, to 12.60 million sessions:
The Library did not meet the target for digital visits, an unanticipated result which the Library is investigating with third-party service providers. (2021-2022 Annual Report, p. 14)
If, as some have argued, the pandemic resulted in GLAM institutions (galleries, libraries, archives, and museums) internationally moving further into the digital age, and Australians more than doubled their screentime, it would seem that Trove did not get a share of this captive audience. This seems counter-intuitive.
So what’s happening here? Why such a sharp decline? Is any of this related to the 2020 redesign of the interface? And if the 22 million figure is now wrong, what does this mean for the future of Trove?
The short answer to all these questions is: we don’t know, and if the results of the investigation with third party providers are not in yet the NLA may not either. But caution is required.
As the 2020-2021 report suggests, visit/session numbers are affected by a range of things, from bots and crawlers to visibility via other services like Google, to the range and type of new content coming online. The 2021-2022 report also notes that the ‘sharpest decline’ in digital visits ‘was observed in international usage, but Australian usage was also lower than in previous years.’ The NLA’s reporting would benefit by providing more granular detail in areas like this.
The number of unique visits over time needs to be factored in too. Are the same number of people (or computers) visiting, but less often? If so, does this mean people are finding what they need in fewer visits (which is surely a good thing), or are they finding the platform less interesting, making them less likely to return (which is clearly not so good)? What are the international and Australian figures for unique visits, and what might they tell us about local usage?
And specifically, who are these people? Over the years the National Library has occasionally tried to argue that the primary users of Trove are academics. Their own numbers would seem to suggest otherwise—were that there are so many university employees in Australia! One of the truly remarkable things about Trove is the way it has further challenged the increasingly-outmoded idea of history as the account of extraordinary deeds committed by extraordinary people. Trove appeals to so many Australians because it captures the history of ordinary lives. It’s a resource for ordinary people. A true redefining of public interest.
We also need to understand more about what people are doing when they come to Trove. The NLA’s documentation is not specific on this either. We know more about how long people spend in Trove than what they actually do. In addition to claiming 63,564.5 Average Daily Sessions, the Trove Strategy states the Average Session Duration is 6 minutes 52 seconds. Over what period is the average calculated? If, like the 22 million figure, it is an average over 6 years, how has this number changed over time? Do people spend more or less time on the site since the 2020 redesign? If more time, does this mean they are more engrossed or it’s taking longer to find what they are looking for? If less time, does this mean they are finding things more quickly and leaving satisfied, or rolling their eyes and giving up? What is the bounce rate (where visitors leave shortly after landing on the site)?
Like all usage stats, the numbers in the annual reports really need to be seen in the context of a range of other metrics, including qualitative data. Otherwise, they raise far more questions than they answer.
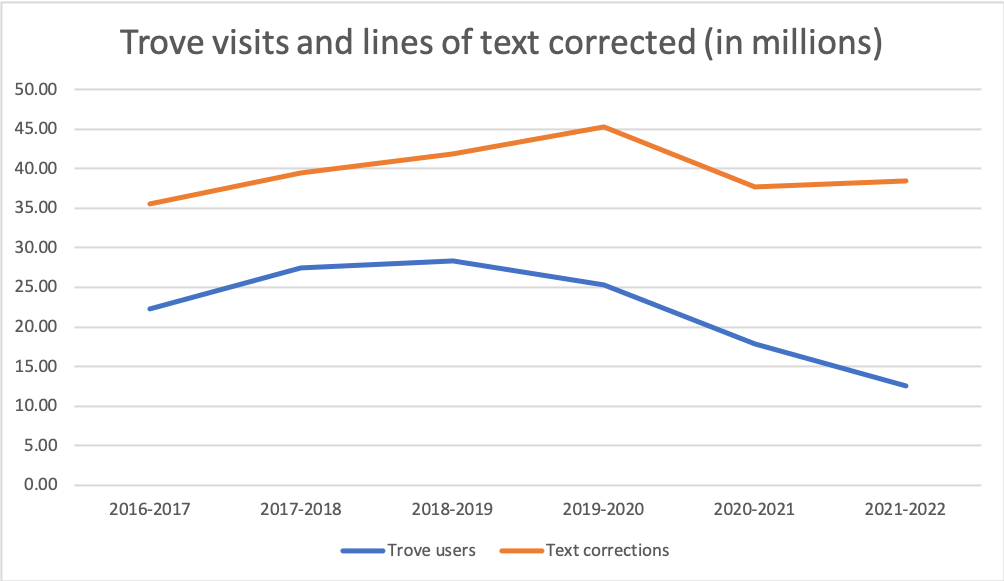
With so many variables involved, there’s one publicly available figure that is potentially more interesting. Here are the number of lines of text corrected by Trove users shown alongside session/visit numbers.
The option to correct digitised historical newspaper text captured using optical character recognition has been a core part of the Trove platform since its launch in 2009. According to the NLA, more than 430 million lines of text have been corrected since the platform went live in 2009.
There was a noticeable decline from 2019-2020 to 2020-2021, but not as precipitous as the fall in the number of sessions. And though session numbers continued to decline, text corrections rallied slightly. It’s still down around 15% on the 2019-2020 peak, but it seems that engagement with one of the key features of the Trove platform has stabilised (for now at least).
We need to keep asking questions of the NLA and the broader Trove service, not least because this is taxpayer-funded public infrastructure. But we also need to be careful not to put too much stock in blunt numbers or invest in the rhetoric of neo-liberal assessments of ‘performance’ such as gross usage or efficiency.
I think statistics go in one ear and out the other. All of us respond to stories more than numbers.
Koren Zailckas
Whether visited 20 million times or half that, we need to ask who is (and more importantly who is not) using Trove, what they find there (and what they don’t), and how they access and use what they find (or not). Sometimes the real story lies behind the numbers—in the shadows of the undetected rather than the readily described.
As with any public infrastructure, value should not just be measured by volumes of traffic. It’s found in individual and collective journeys, interesting detours, exasperated intentions, unexpected destinations, and the many connections we make along the way.
January 5, 2023 at 3:47 am
Great post!
January 5, 2023 at 7:55 am
Thanks Rachel!